Setting up your trade research vault
When you are analyzing real-time market movements, your data is your most valuable asset. A local, offline-first vault ensures that your proprietary trading strategies, entry/exit logic, and P&L records never leave your machine. This sovereignty protects your edge from cloud sync errors, privacy breaches, or platform downtime.
Structure your vault for speed and clarity. Use a flat folder hierarchy for active trades and a separate archive for closed positions. Name files with a consistent date-based format (e.g., 2024-05-20-BTC-Long) so your graph view and search functions can instantly connect related notes. Keep your core templates lightweight; complex metadata slows down the rapid logging required during volatile sessions.
To keep your analysis grounded in current market reality, anchor your research with live data. Embed a price widget for your primary asset to maintain context without leaving your notes.
This setup transforms Obsidian from a simple note-taking app into a dedicated trading journal. By keeping everything local, you ensure that your research remains private, fast, and entirely under your control.
Vault Setup Checklist
-
Create a dedicated Trading folder in your vault root.
-
Set up a Templates folder with a Trade Log template.
-
Configure your daily note template to include a Daily P&L summary section.
-
Install a local-first markdown table plugin for quick trade entry.
-
Enable graph view to visualize connections between related trade ideas.
Tracking OBSDN price action locally
Static spreadsheets break the moment the market moves. To analyze OBSDN effectively, you need a system that pulls live data directly into your vault, keeping your research sovereign and immediate. By integrating community-built plugins, you can replace manual copy-pasting with dynamic dashboards that update in real time.
The foundation of this setup is a reliable price widget. Using a provider-backed widget for OBSDN ensures you are always looking at current market status, not stale data from a previous session. This single component transforms a static note into a living terminal.
For deeper technical analysis, a live chart allows you to overlay indicators like RSI or moving averages without leaving your workspace. This visual context is critical for identifying entry and exit points while you are reviewing your trade notes. The chart below demonstrates how real-time price action can be visualized alongside your local research.
This local-first approach mirrors workflows shared by traders in the Obsidian community. For instance, users on r/Daytrading have documented how they combine plugins and automation to turn daily profit and loss figures into comprehensive dashboards. Tools like the Journalit plugin further extend this capability, offering account dashboards built for tracking prop firm targets and drawdowns.

By keeping your data local, you avoid the latency of web-based tools and the privacy risks of third-party servers. Your OBSDN analysis becomes a continuous, integrated process rather than a series of disconnected snapshots.
Automating trade review notes
Manual data entry is the enemy of accurate trade analysis. When you’re reviewing a complex position, typing in entry price, exit price, and P&L by hand introduces friction—and errors. A single typo in a decimal place can skew your performance metrics, making it hard to trust your journal.
The solution is to automate the capture of these core details. By using local-first plugins, you ensure that your trade data stays within your own vault, respecting data sovereignty while speeding up your workflow. This approach mirrors how developers use templating engines to generate boilerplate code; here, we’re generating structured financial data.
Manual vs. Automated Capture
The difference in workflow efficiency is stark. Below is a comparison of the two approaches:
| Feature | Manual Entry | Automated Plugin |
|---|---|---|
| Data Accuracy | Prone to typos | Direct from source |
| Speed | Minutes per trade | Seconds per trade |
| Data Sovereignty | Full control | Full control (local) |
| Analysis Ready | Requires cleaning | Structured YAML frontmatter |
How it works in practice
Community discussions on the Obsidian forums highlight plugins like Journalit as effective tools for this task. These plugins connect to your trading data sources or use smart templates to populate fields automatically. Instead of writing a paragraph describing a trade, you get a structured block with metadata:
---
entry: 42000
exit: 43500
pnl: 1500
status: closed
---
This structure allows you to run queries later. You can instantly filter all trades where P&L was negative, or calculate your win rate over the last month. The automation handles the grunt work, leaving you to focus on the why behind the numbers, not the what.
By keeping this process local, you maintain complete ownership of your trading history. No cloud sync delays, no third-party servers holding your financial data. It’s a simple shift in infrastructure that pays for itself in saved time and improved data integrity.
Analyzing performance patterns
The graph view in Obsidian isn't just a pretty visualization; it's a spatial map of your trading logic. When you tag your OBSDN trades with specific setups—like #long-liquidation or #short-volatility-spike—you create a network of cause and effect. Instead of scrolling through a static spreadsheet, you can visually trace which tags cluster together. This helps you spot recurring mistakes or successful setups that might be hidden in a list format.
To make this work, you need a consistent tagging taxonomy. Don't just tag the asset. Tag the context. For example, use #context-low-volume or #entry-slow. Over time, your graph will show dense clusters around certain conditions. If you notice a tight knot of red-marked trades all connected to the #context-low-volume tag, you've identified a pattern. You're not just seeing individual losses; you're seeing a systemic vulnerability in how you trade during thin markets.
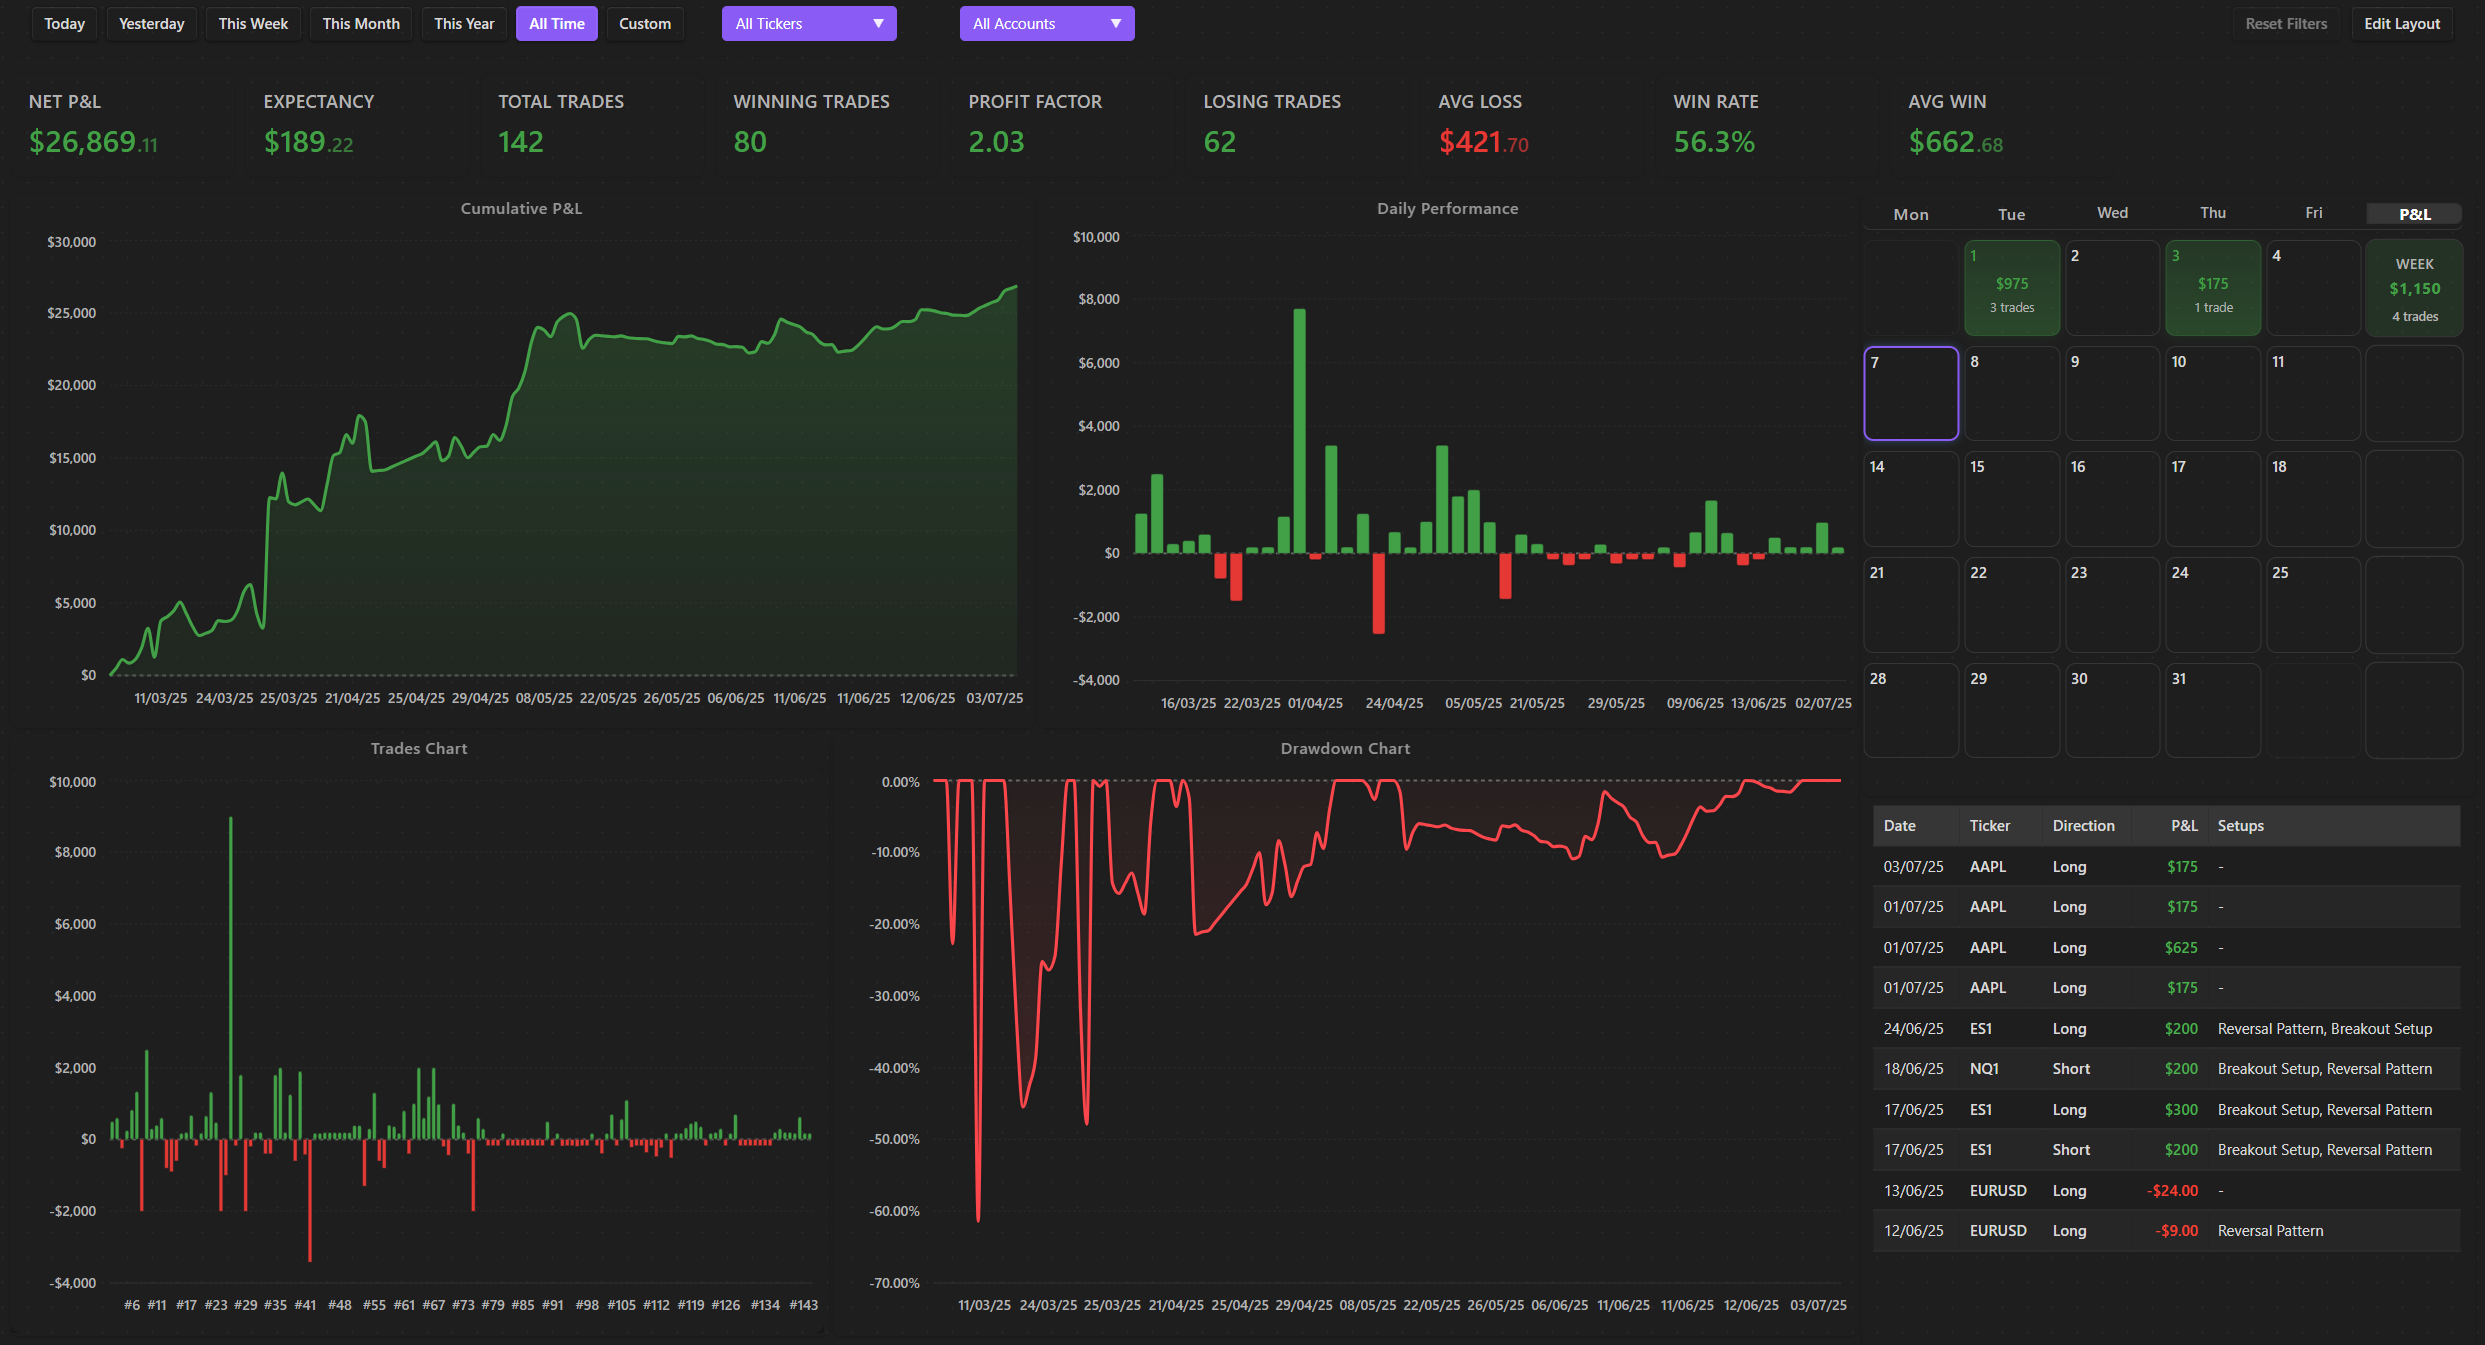
For deeper quantitative analysis, consider using the Journalit plugin. It provides a trading dashboard that tracks performance and patterns at a glance, allowing you to overlay your manual notes with calculated metrics. This bridges the gap between qualitative journaling and quantitative review. By keeping your data local in Obsidian, you maintain full sovereignty over your trade history, ensuring that your personal edge isn't locked away in a proprietary platform's database.
Essential tools for your setup
Building a local-first trading infrastructure requires hardware that handles data processing without compromising privacy, paired with software that keeps your analysis tethered to your own vault. The Obsidian community emphasizes that your tools should serve as a private ledger, not a cloud-dependent dashboard.
For hardware, a machine with a strong multi-core processor and at least 32GB of RAM ensures that complex charting overlays and large vaults load instantly. Pair this with a secondary monitor dedicated to real-time price feeds, keeping your primary screen clear for journaling and pattern recognition. This physical separation reduces cognitive load during high-volatility periods.
On the software side, the Journalit plugin is the standard for local trade tracking. It allows you to log entries directly within Obsidian, keeping your P&L, drawdowns, and review notes in one searchable, encrypted location. Community members often combine this with the Trading Dashboard plugin to visualize performance metrics without exporting data to external servers.


As an Amazon Associate, we may earn from qualifying purchases.
Common questions about trade analysis
Trade analysis software helps you move past gut feelings and look at the hard data behind your positions. When you break down your history, you can see exactly where your edge exists or where the market is charging you too much.
The goal is to find a workflow that keeps your data local and under your control. Many traders in the Obsidian community prefer tools that export clean CSVs or sync via local folders, ensuring your trade history remains sovereign.
No comments yet. Be the first to share your thoughts!