Why infrastructure matters for traders
OBSDN Trade works best as a clear sequence: define the constraint, compare the realistic options, test the tradeoff, and choose the path with the fewest hidden costs. That order keeps the advice usable instead of decorative. After each step, pause long enough to check whether the recommendation still fits the reader's actual situation. If it depends on perfect timing, unusual access, or a best-case budget, include a simpler fallback.
The simplest way to use this section is to write down the real constraint first, compare each option against it, and choose the path that still works outside ideal conditions.
Essential software stack for research
Building a reliable OBSDN Trade guide starts with the right data infrastructure. You need tools that ingest raw market signals and store them in a way that survives the chaos of volatile sessions. This isn't about flashy dashboards; it's about creating a durable, searchable record of what actually happened.
The core stack generally splits into two buckets: aggregation and storage. Aggregation tools pull price feeds, on-chain metrics, and news wires into one stream. Storage tools—like Obsidian or Notion—provide the local environment where you connect those dots. Without this separation, you're just staring at a screen, hoping patterns emerge.
| Category | Primary Function | Example Tools | Data Source | Latency |
|---|---|---|---|---|
| Aggregation | Real-time price & volume | TradingView, Glassnode | Exchange APIs, On-chain | Low (ms) |
| News/Sentiment | Macro & project updates | CryptoPanic, LunarCrush | Social, News Wires | Medium (s) |
| Note-taking | Local knowledge base | Obsidian, Logseq | User-generated | N/A |
| Execution | Order management | Exchange UIs, 3Commas | Exchange APIs | Low (ms) |
For the aggregation layer, you want reliability over novelty. TradingView remains the standard for charting because its data feeds are widely accepted as the market benchmark. For deeper on-chain context, Glassnode provides institutional-grade metrics that help distinguish between noise and structural shifts. These tools feed the narrative; they don't replace your analysis.
The storage layer is where your OBSDN Trade guide actually takes shape. Obsidian has become the preferred choice for many traders because it stores data locally in plain text Markdown files. This means your research isn't locked behind a subscription wall or vulnerable to a platform shutdown. You can link a chart screenshot directly to a transaction hash or a news article, creating a web of evidence rather than a linear diary.
Community discussions on Reddit often highlight the importance of templating in these workflows. Users frequently share how they structure their trading notes to include specific fields for entry, exit, and emotional state. This standardization turns scattered thoughts into comparable data points, making it easier to audit your performance later.
| Tool | Type | Strength |
|---|---|---|
| TradingView | Charting | Real-time data accuracy |
| Obsidian | Note-taking | Local storage & linking |
| Glassnode | On-chain | Deep blockchain metrics |
Charting and technical analysis tools
Technical analysis in the OBSDN Trade guide isn't about guessing; it's about seeing the board clearly before you move. The platform integrates provider-backed charts directly into the interface, giving you real-time data without the lag or clutter of third-party overlays. This approach ensures that every candlestick, volume spike, and trend line reflects live market conditions, which is essential when you're executing trades in a fast-moving environment.
By relying on these integrated widgets, you avoid the common pitfall of decision paralysis. As noted in trading best practices, the worst time to decide what you're going to do is after you've already clicked buy or sell. Having a robust charting tool at your fingertips allows you to set clear entry and exit points based on visible support and resistance levels, turning emotional reactions into calculated moves.
The OBSDN Trade guide emphasizes using these visual aids to identify patterns that signal potential market shifts. Whether you are tracking the volatility of Bitcoin against the US Dollar or analyzing the steady movement of major equity indices, the ability to zoom in on specific timeframes helps you catch subtle opportunities. This clarity reduces risk by ensuring you are acting on data, not intuition.
For traders who need a quick snapshot of asset performance alongside their charts, the platform also supports live price widgets. These provide immediate context on price trends, allowing you to gauge momentum without switching tabs. Combining this price data with the detailed charting tools creates a cohesive analytical environment that supports both short-term scalping and longer-term position trading.

Hardware and connectivity requirements
OBSDN Trade troubleshooting should start with a clear boundary: what is actually broken, and what still works normally. Check the display, network connection, paired devices, app access, and recent updates before assuming the whole system needs a reset. A small connection failure can make the main screen feel unreliable even when the core system is fine. Work from low-risk checks to deeper resets. Confirm power state, safe parking, account access, and signal first. Then restart the interface, wait for it to reload completely, and test the original symptom. Avoid changing multiple settings at once because that makes it harder to know which step actually fixed the problem. If the issue affects safety information, repeats after every restart, or appears with warning messages, treat the reset as a temporary diagnostic step rather than the final fix. Document the symptom and move to official support instead of stacking more DIY attempts.
The simplest way to use this section is to keep the setup small, verify each change, and record the stable configuration before adding optional accessories.
Build a reliable trading journal
A trading journal is the bridge between raw data and genuine insight. Without a structured record, research findings remain scattered notes that fade under the pressure of the next candle. Integrating your OBSDN Trade guide research into a personal journal ensures that every win and loss contributes to a clear, actionable history.
The goal is to capture the context of the trade, not just the exit price. When you document the reasoning behind an entry, you create a feedback loop that sharpens your OBSDN Trade guide strategy over time. This section walks through the essential steps to set up a journal that actually improves your performance.
Start by creating a dedicated folder structure in your note-taking app. This keeps your OBSDN Trade guide research separate from daily life notes. Use tags like #trade-setup or #strategy-review to make filtering effortless. A clean digital environment reduces friction when you need to log a trade quickly.
Design a template that forces you to record your thesis before you click buy. Include fields for entry price, stop loss, take profit, and the specific OBSDN Trade guide signal that triggered the action. This structure prevents vague entries and ensures every trade has a clear, reviewable origin story.
Record the trade details as soon as it opens. Delaying entry often leads to forgotten nuances, such as emotional state or market conditions. Capture the exact moment your research aligned with the chart. This real-time logging preserves the integrity of your OBSDN Trade guide analysis for later review.
Once the trade closes, return to the note to document the result. Tag it with #win or #loss and add a brief note on what went right or wrong. This post-trade analysis is where the real learning happens. It transforms isolated events into pattern recognition for your OBSDN Trade guide strategy.
At the end of each month, filter your tagged trades to find trends. Are you losing more on short positions? Does your OBSDN Trade guide strategy perform better in specific market conditions? Use this data to adjust your rules. Regular review turns your journal into a living tool for continuous improvement.
Building this habit takes discipline, but the payoff is significant. By consistently logging and reviewing your trades, you move from guessing to knowing. Your OBSDN Trade guide becomes a refined instrument, calibrated by your own verified data rather than hope.
Common questions about trading tools
Choosing the right infrastructure for your OBSDN Trade Guide setup often raises specific questions about strategy and execution. The focus here is on practical application—how to structure your research so it supports real-time decision-making rather than slowing it down.
How does OBSDN Trade improve my trading strategy?
The OBSDN Trade guide emphasizes that the worst time to decide what you are going to do is after you have already clicked buy or sell. By using structured research tools, you move decision-making into the planning phase. This allows you to enter positions with a clear thesis rather than reacting to market noise.
What is the 90% rule in trading?
While not a universal law, the "90% rule" often refers to the high failure rate of new traders who do not have a documented plan or risk management system. The OBSDN Trade approach mitigates this by requiring you to log your rationale for every trade. This discipline helps filter out emotional impulses and keeps your strategy aligned with your long-term goals.
Can I use these tools for real-time market research?
Yes. The primary goal of these infrastructure tools is to streamline your note-taking process so you can refocus on the charts themselves. Whether you are tracking crypto assets or forex pairs like AUD/NZD, having a centralized database for your analysis ensures you have context when liquidity shifts or new data emerges.
Helpful gear
Use these product recommendations as a starting point, then choose the size, material, and price point that fit how you actually use the gear.

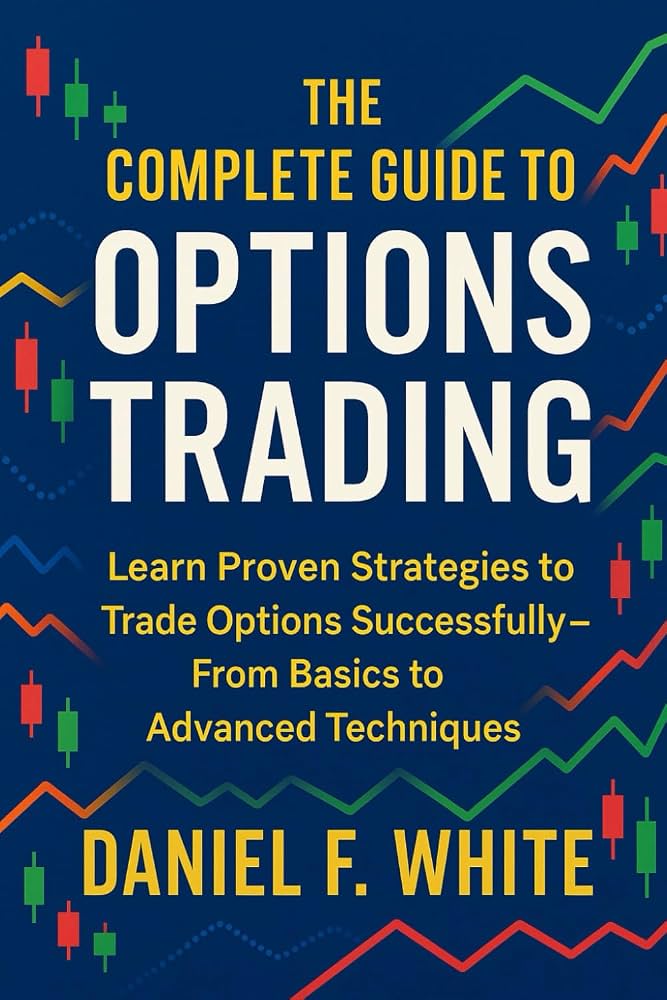

As an Amazon Associate, we may earn from qualifying purchases.
No comments yet. Be the first to share your thoughts!