Why real-time data matters
Crypto markets do not pause for sleep, and they certainly do not respect time zones. A price movement that takes minutes to register in a delayed feed can be hours of missed opportunity—or a catastrophic loss—in the actual market. Static data, whether it is a spreadsheet updated once a day or a chart with a 15-minute delay, is already history. By the time you see it, the trade has been made, the liquidity has shifted, and the narrative has changed.
This latency is the primary reason manual research fails at scale. In traditional finance, even milliseconds matter, but in crypto, the volatility is compounded by fragmented liquidity across dozens of exchanges and decentralized protocols. A "best price" on one platform might vanish in seconds as arbitrage bots clean up the order book. Relying on outdated snapshots means you are essentially trading blindfolded, reacting to ghosts of prices that no longer exist.
To navigate this environment, you need infrastructure that mirrors the market’s speed. This means moving away from static reports and toward live, real-time data streams. The goal is not just to see what happened, but to understand what is happening now. This shift from hindsight to foresight is the difference between guessing and executing with conviction.
The Infrastructure for Live Intelligence
Building a real-time research workflow requires tools that ingest data directly from the source. This includes live order book depth, transaction-level on-chain data, and instant price feeds from major exchanges. These tools strip away the noise of delayed summaries and give you the raw materials to make decisions in the moment.
Think of this infrastructure as your cockpit. In a high-speed aircraft, you do not look at a map of where you were five minutes ago; you look at the instruments showing your current altitude, speed, and fuel. Similarly, a real-time dashboard shows you the current state of liquidity, volatility, and momentum. It allows you to spot anomalies—such as a sudden drop in buy-side support—before they become full-blown crashes.
The key components of this infrastructure are:
- Live Order Books: See the actual buy and sell walls, not just the last traded price. This reveals hidden liquidity and potential resistance levels.
- On-Chain Analytics: Track large wallet movements and smart contract interactions in real time. This helps identify whale activity or protocol exploits as they happen.
- Instant News Feeds: Connect to reliable news wires and social sentiment trackers. In crypto, news drives price faster than fundamentals often do.
Without these live feeds, you are always playing catch-up. The market moves in milliseconds; your research tools should not lag behind by minutes or hours.
Visualizing the Moment
Data is only useful if you can interpret it quickly. Real-time visualization tools transform raw numbers into actionable insights. Instead of scanning rows of data, you see patterns, trends, and divergences at a glance.
For example, a live candlestick chart with volume overlays allows you to see not just the price movement, but the strength behind it. A spike in price accompanied by low volume might indicate a weak move that could reverse, while high volume suggests strong conviction. This visual context is impossible to derive from a static table of numbers.
Also, integrating multiple data streams into a single dashboard reduces the cognitive load. Instead of switching between five different tabs and apps, you have one view of the market. This consolidation allows for faster decision-making and reduces the risk of missing critical information while navigating between tools.
Staying Ahead of the Curve
In the fast-paced world of crypto trading, being first is often more valuable than being right. Real-time data gives you the edge of speed. It allows you to enter positions before the broader market reacts to news, or to exit before a liquidity crunch hits.
However, speed without accuracy is dangerous. Real-time tools must be reliable and accurate. This means using official sources and verified data providers. Avoid tools that rely on aggregated data from unverified sources, as these can be prone to errors or delays.
By prioritizing real-time data and visualization, you shift from a reactive stance to a proactive one. You are no longer just observing the market; you are engaging with it in real time. This is the foundation of effective market research in the crypto space.
Essential infrastructure tools
You can’t build a reliable trading workflow on shaky hardware or slow data feeds. The difference between reacting to a market move and anticipating it often comes down to your setup’s latency and reliability. We’re looking at the core components that power real-time market research: the data sources, the execution engines, and the hardware that keeps them running.
Data Aggregation and Feeds
Your first line of defense is accurate, low-latency data. Retail platforms often throttle data or delay updates to encourage subscription upgrades. Professional setups bypass this by using direct market data connections or robust aggregators.
For crypto, this means connecting directly to exchange APIs (like Binance or Coinbase Pro) rather than relying on free, delayed web widgets. For traditional markets, services like Polygon or IEX Cloud provide the institutional-grade feeds necessary for split-second decisions. If your data is stale, your analysis is already wrong. Prioritize feeds that offer Level 2 order book data and real-time trade execution logs.
Execution Hardware and Connectivity
Hardware isn’t just about having a fast computer; it’s about reducing the physical distance between your decision and the exchange. This is where latency matters most. A dedicated machine with a wired Ethernet connection is non-negotiable. Wi-Fi introduces jitter and potential dropouts that can cost you in volatile markets.
Many serious traders use multiple monitors to separate their analysis chart from their execution interface. This reduces cognitive load and prevents accidental clicks. If you’re trading high-frequency strategies, consider colocated servers or VPS (Virtual Private Server) locations near the exchange’s data centers. The goal is to minimize the time between your signal and the order hitting the book.
Comparing Infrastructure Components
Not all tools offer the same balance of speed, cost, and reliability. Here is how the core infrastructure options stack up against each other.
| Component | Latency | Cost | Reliability |
|---|---|---|---|
| Free Retail Platform | High (Delayed) | $0 | Low (Throttled) |
| Direct Exchange API | Low | Moderate (API Fees) | High |
| Professional Data Feed (e.g., Polygon) | Very Low | High | Very High |
| Colocated VPS | Ultra-Low | Very High | Very High |
Market Context Widget
While infrastructure is foundational, you need to see the market in action to validate your setup. Use live charts to monitor the tools you’re testing. Below is a live chart for a major asset pair to help you gauge real-time volatility and execution speed.
Software stack for analysis
Building a cohesive trading workflow isn't about finding the single best tool; it's about connecting the right ones so data flows without friction. Most successful traders treat their software stack like a pipeline: capture the chart, log the decision, and review the outcome. When these pieces talk to each other, you stop wrestling with tabs and start focusing on the market.
Start with a charting platform that handles real-time data cleanly. For crypto markets, a live chart provides the necessary context for your analysis without the lag of static screenshots. Embedding a direct TradingView widget ensures you're always looking at current pricing and volume profiles.
Next, integrate a journaling tool. Obsidian has become a standard for traders who want to link their trade reviews with study notes and daily reports. The community discussion around using Obsidian for trading journals highlights its flexibility—you can create custom templates for pre-market checklists or post-trade retrospectives. This isn't just about storing data; it's about creating a searchable knowledge base that helps you spot behavioral patterns over time.

The real power comes when you combine these. Use your charting tool to capture the setup, then paste the analysis into your journal with tags for strategy, emotion, and outcome. This creates a feedback loop that is far more valuable than isolated trades. As seen in community workflows, linking your ICT study notes directly to live trade examples helps solidify theoretical concepts into practical execution.
RedditThread url="https://www.reddit.com/r/trading/comments/obsidian_workflow/" title="Traders sharing their Obsidian setups" excerpt="Detailed breakdowns of how traders link charting data with daily journaling to improve consistency." />
Keep your stack minimal. Two or three well-integrated tools beat a dozen disconnected apps. Prioritize speed and clarity so your analysis remains sharp and your review process is consistent.
Live Market Context Integration
Stale data is the silent killer of trading strategies. If your research relies on prices from yesterday, your edge is already gone. The goal here is simple: keep your workflow tethered to the present moment. You need tools that pull live prices and sentiment without forcing you to leave your analysis environment.
Start with a live price anchor. Instead of manually refreshing browser tabs, embed a real-time widget for your primary asset. For example, tracking Ethereum against USDT gives you an immediate pulse on volatility and liquidity. This isn't about staring at a ticker; it's about ensuring your baseline assumptions match current market reality.
Beyond price, sentiment shifts faster than fundamentals. Integrate tools that aggregate social signals and news flow directly into your dashboard. Look for platforms that offer API access or browser extensions that overlay sentiment scores on your charts. This allows you to spot divergences—like price rising while social sentiment turns negative—before they become obvious to the wider market.
Finally, automate the refresh. Manual checks create gaps where opportunities vanish. Set up alerts for volume spikes or sudden sentiment drops. By automating the "noise" filtering, you preserve mental energy for the actual decision-making process. Your research should feel like a live feed, not a historical archive.
Building your trade journal
A trading journal is the feedback loop that turns random luck into repeatable skill. Without a structured way to capture and review your activity, you’re just guessing what works. The goal isn’t to record every tick; it’s to build a system that highlights your biases and errors.
Step 1: Capture the Setup
The first step is recording the trade before or as it happens. This locks in your logic before emotion clouds the memory. Note the asset, entry price, and the specific reason for the trade. If you’re trading crypto, you can track the price movement in real-time to ensure your entry aligns with market conditions.
Record the asset, entry price, and the specific reason for the trade. This locks in your logic before emotion clouds the memory. Use a tool that allows you to tag the setup type (e.g., breakout, reversal) for easy filtering later.
Step 2: Define Your Exit Strategy
Before you click buy, decide how you’ll get out. A journal entry should include your target price and stop-loss level. This pre-commitment removes hesitation during the trade. If the market moves against you, the plan is already written, preventing the common mistake of moving stops.
Define your take-profit and stop-loss levels immediately. This removes hesitation during the trade. A clear exit strategy ensures you aren’t reacting to price swings but executing a pre-planned move.
Step 3: Review and Reflect
The most critical step happens after the trade closes. Review the outcome against your original plan. Did you follow the rules? Did you exit early due to fear? This reflection is where the real learning happens. Use a checklist to ensure you’ve covered all aspects of the trade, from setup to execution.
Review the trade against your original plan. Did you follow the rules? Did you exit early due to fear? This reflection is where the real learning happens. Use a checklist to ensure you’ve covered all aspects of the trade, from setup to execution.
Step 4: Build the Feedback Loop
Consistency comes from recurring reviews. Weekly or monthly, look for patterns in your losses and wins. Are you losing more on weekends? Are your breakout trades underperforming? This data-driven approach helps you refine your strategy over time, turning your journal into a living document of your trading evolution.
Look for patterns in your losses and wins. Are you losing more on weekends? Are your breakout trades underperforming? This data-driven approach helps you refine your strategy over time, turning your journal into a living document of your trading evolution.
Recommended tools for traders
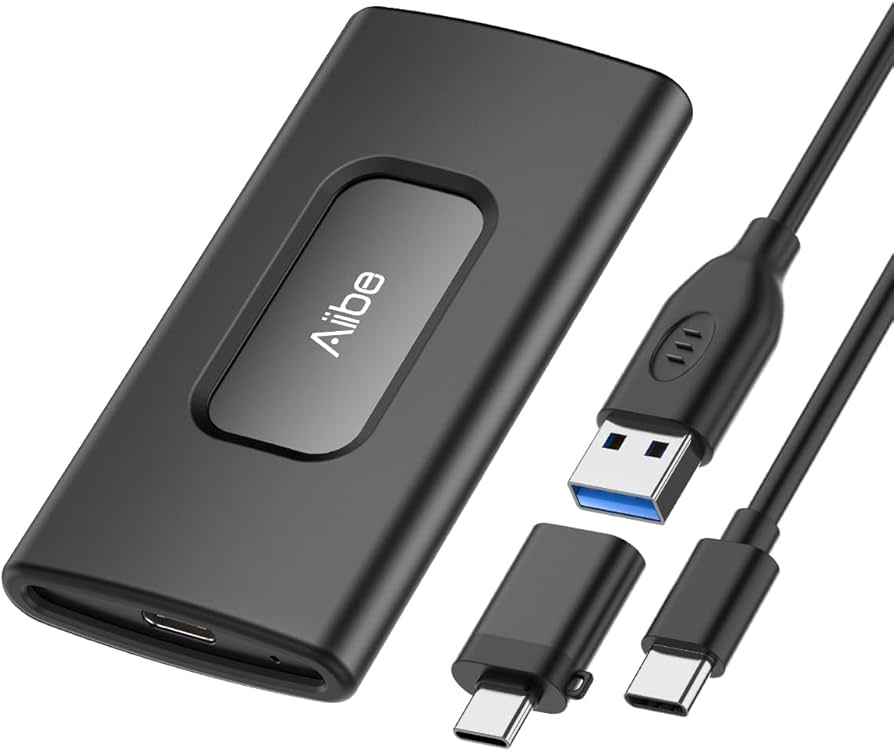
Real-time market research demands reliable infrastructure. The right hardware and software accessories reduce latency, improve data accuracy, and keep your workflow stable during volatile sessions. Below are concrete recommendations for trading gear that support the OBSDN Trade guide’s infrastructure.


As an Amazon Associate, we may earn from qualifying purchases.
These tools form the backbone of a professional trading setup. A mechanical keyboard ensures precise input during fast-moving markets, while an external SSD provides the speed needed for real-time data processing. Noise-canceling headphones help maintain focus in noisy environments, allowing you to concentrate on charts and analysis without interruption.

Common questions about OBSDN Trade
Traders often ask how to structure their real-time research workflow without getting overwhelmed by data noise. The core strategy is to anchor your analysis on official infrastructure updates rather than speculative social feeds. Use the tools below to filter signal from noise.
No comments yet. Be the first to share your thoughts!